
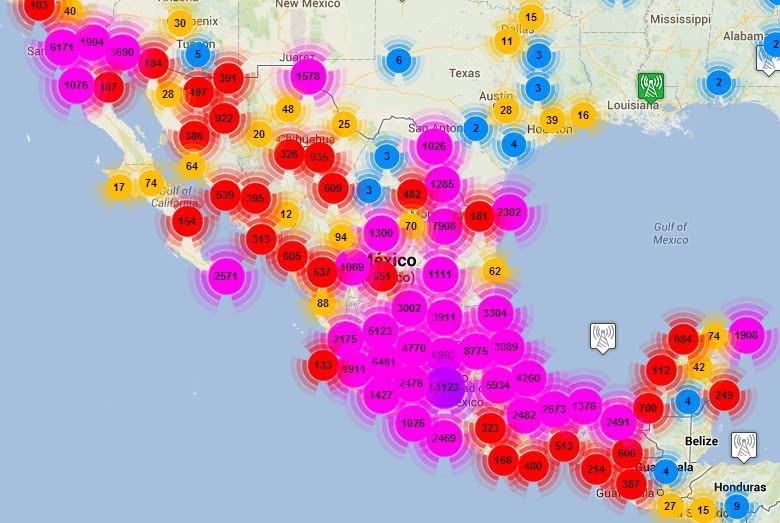
Fifteen years ago I wrote about a key generator for Huawei gateways whose default WEP/WPA keys were derived from the MAC address printed on the sticker. The joke at the time was that Telmex had just “upgraded” my 2Wire router to one of them. I have wondered ever since how far that class of problem actually spread.
This is an attempt to answer it with numbers. A crowd-sourced radio survey, a wardriving app with phones logging every beacon they heard along with a GPS fix and a timestamp, recorded 28,113,649 Wi-Fi sightings across Mexico between 2015 and 2022. After de-duplication, 14,841,658 distinct access points remain, and roughly half of them are still broadcasting the name their factory gave them.
The source is a 5.5 GB MySQL dump of a single networks table, dumped 2024-06-05, from which a streaming parser recovered 36,543,913 rows. Everything below is restricted to rows with country_code = 'MX', collapsed to distinct BSSIDs. Each access point is counted in the year it was first observed.
No BSSIDs, SSID-to-location pairs or coordinates are published here, and none will be. The aggregate is the interesting part.
Headline figures
| Metric | Value | Share |
|---|---|---|
| Distinct access points | 14,841,658 | from 28,113,649 sightings |
| Open, WEP or WPA1 | 3,408,416 | 23.0% |
| Advertising WPS | 8,490,025 | 57.2% |
| Factory SSID unchanged | 7,291,417 | 49.1% |
| Factory SSID and WPS | 5,255,074 | 35.4% |
| Speaking WPA3 | 38 | 1 in 390,570 |
| Recorded on 2.4 GHz | 14,415,716 | 97.1% |
| Recorded on 6 GHz | 0 | 0.00% |
What this archive actually is
This is not a census. Coverage follows the people who ran the app, which means highways, cities and the routes between them, and it thins out fast in places nobody drove.
Two facts shape every number below.
- The archive is front-loaded. 57.4% of all distinct access points were first seen in 2015 alone, and collection had all but stopped by 2022.
- It is overwhelmingly a 2.4 GHz record, 97.1% of radios, because that is what Android’s scan API reliably returned on the handsets of the era.
Read the aggregate as a portrait of the mid-2010s Mexican home. Read the year-by-year cohorts for the direction of travel.
| Year first seen | Access points | Share of archive | |
|---|---|---|---|
| 2015 | 8,521,519 | 57.4% | ██████████████████ |
| 2016 | 3,376,506 | 22.8% | ███████ |
| 2017 | 1,547,415 | 10.4% | ███ |
| 2018 | 842,978 | 5.7% | ██ |
| 2019 | 320,343 | 2.2% | █ |
| 2020 | 155,963 | 1.1% | ▏ |
| 2021 | 67,681 | 0.5% | ▏ |
| 2022 | 9,253 | 0.1% | ▏ |
The 2015 spike is the app’s launch year, when every network it heard was new to the database. The decay after that is the collection effort winding down, not Mexico losing routers.
Security: how Mexico locked its doors
Nearly one access point in four offered no meaningful protection at all: open, WEP, or first-generation WPA. Just 38 out of 14,841,658 spoke WPA3.
| Protection | Status | Access points | Share | |
|---|---|---|---|---|
| Open | no encryption | 1,086,388 | 7.32% | ███ |
| WEP | broken in public since 2001 | 1,756,268 | 11.83% | █████ |
| WPA1 | deprecated | 565,760 | 3.81% | ██ |
| WPA/WPA2 mixed | fallback-capable | 6,786,640 | 45.73% | ██████████████████ |
| WPA2 | current baseline | 4,646,516 | 31.31% | ████████████ |
| WPA3/SAE | modern | 38 | 0.0003% | ▏ |
| OWE | opportunistic | 48 | 0.0003% |
WPA/WPA2 mixed advertises both generations so older clients can still associate, which means the network is only as strong as the weakest handshake it will accept. Counted on its own it is the single largest group in the archive.
Composition of each year’s newly-seen access points, as a percentage of that cohort:
| Cohort | n | Open | WEP | WPA1 | WPA/WPA2 mixed | WPA2 | WPA3/SAE |
|---|---|---|---|---|---|---|---|
| 2015 | 8,521,519 | 8.0% | 18.2% | 5.1% | 47.5% | 21.2% | 0.0% |
| 2016 | 3,376,506 | 6.9% | 4.6% | 2.6% | 48.0% | 37.9% | 0.0% |
| 2017 | 1,547,415 | 6.0% | 2.4% | 1.8% | 40.8% | 48.9% | 0.0% |
| 2018 | 842,978 | 5.7% | 1.4% | 1.1% | 38.1% | 53.7% | 0.0% |
| 2019 | 320,343 | 5.7% | 0.9% | 0.6% | 30.6% | 62.3% | 0.0% |
| 2020 | 155,963 | 5.0% | 0.6% | 0.4% | 31.8% | 62.2% | 0.0% |
| 2021 | 67,681 | 4.6% | 0.5% | 0.3% | 29.0% | 65.6% | 0.0% |
| 2022 | 9,253 | 8.2% | 0.3% | 0.3% | 23.8% | 66.9% | 0.1% |
WEP, broken in public since 2001 and recoverable in minutes, accounted for 18.2% of everything first seen in 2015. By the 2019 cohort it was 0.9%. That collapse is almost entirely a hardware story: Telmex and its peers swapped out the Thomson and 2Wire gateways that had shipped with WEP keys printed on the sticker.
Open networks did not follow. They held between 4.6% and 8.2% of every cohort, start to finish and with no trend, because open networks are mostly not misconfiguration. They are hotspots, guest SSIDs, retail Wi-Fi and municipal projects that are supposed to be open.
Sample sizes differ by three orders of magnitude between 2015 and 2022. That 2022 column rests on 9,253 access points, so treat it as a hint, not a measurement.
WPS: the door that never closed
Every weak protocol in this archive declined over time. One exposure went the other way.
Wi-Fi Protected Setup lets a client join by proving knowledge of an eight-digit PIN. In 2011 Stefan Viehböck showed the PIN is validated in two halves, collapsing the search space from 100 million to about 11,000. In 2014 the Pixie-Dust attack reduced many chipsets to an offline computation taking seconds. A router with WPS enabled hands over its WPA2 passphrase regardless of how strong that passphrase is.
57.2% of Mexican access points in this archive advertise WPS. Among WPA/WPA2 mixed-mode networks, the largest group, it is 75.3%. And unlike WEP, the rate does not fall with time: the 2015 cohort sits at 49.7%, every cohort after it sits between 60.9% and 68.6%.
| Protection | Access points | WPS advertised | Rate |
|---|---|---|---|
| Open | 1,086,388 | 79,025 | 7.3% |
| WEP | 1,756,268 | 58,938 | 3.4% |
| WPA1 | 565,760 | 138,511 | 24.5% |
| WPA/WPA2 mixed | 6,786,640 | 5,112,636 | 75.3% |
| WPA2 | 4,646,516 | 3,100,908 | 66.7% |
| WPA3/SAE | 38 | 7 | 18.4% |
Two trends, opposite directions:
| Cohort | n | WPS | Weak (open, WEP or WPA1) | Factory SSID | TKIP | 5 GHz |
|---|---|---|---|---|---|---|
| 2015 | 8,521,519 | 49.7% | 31.3% | 51.0% | 52.1% | 1.71% |
| 2016 | 3,376,506 | 67.0% | 14.1% | 51.3% | 49.5% | 2.85% |
| 2017 | 1,547,415 | 68.6% | 10.2% | 43.9% | 42.7% | 4.80% |
| 2018 | 842,978 | 67.5% | 8.2% | 39.1% | 39.8% | 6.45% |
| 2019 | 320,343 | 65.5% | 7.2% | 37.1% | 31.2% | 8.83% |
| 2020 | 155,963 | 64.6% | 6.0% | 36.5% | 29.9% | 9.23% |
| 2021 | 67,681 | 65.1% | 5.4% | 33.7% | 27.5% | 12.61% |
| 2022 | 9,253 | 60.9% | 8.8% | 31.2% | 22.6% | 15.91% |
As operators retired WEP hardware they replaced it with WPA2 gear that shipped with WPS switched on by default, trading a broken cipher for a bypassable one.
Put the two together and 35.4% of every access point in the archive carries an unchanged factory SSID and an advertised WPS PIN, the two properties that make a network guessable without ever capturing a handshake.
Defaults: nobody changed the name
49.1% of Mexican access points still broadcast a factory-issued SSID. Four in ten of all networks in the country carry some form of Telmex’s INFINITUM.
A default SSID is not itself a vulnerability. What makes it matter is the thing I was writing about in 2011: the name is generated from the device, typically from bytes of the BSSID, and so is the factory Wi-Fi key. Where the generation algorithm has been recovered, and for several of these families it has been published for over a decade, the SSID visible in a scan is enough to compute a candidate passphrase offline. The prefix tells you which key-derivation recipe to try.
| Pattern | Operator | Access points | Share of all MX | WPS on |
|---|---|---|---|---|
INFINITUMxxxx | Telmex | 3,205,113 | 21.60% | 73.5% |
INFINITUMXXXXXX | Telmex | 1,696,029 | 11.43% | 61.2% |
ARRIS-XXXX | izzi / cable | 989,777 | 6.67% | 91.5% |
INFINITUMxxxx_2.4 | Telmex | 512,283 | 3.45% | 94.4% |
INFINITUMXXXX | Telmex | 473,672 | 3.19% | 54.6% |
TP-LINK_XXXXXX | retail router | 100,381 | 0.68% | 75.3% |
IZZI-XXXX | izzi | 77,727 | 0.52% | 97.3% |
Huawei-MODEL-XXXX | Telmex / other | 76,777 | 0.52% | 2.3% |
MEGACABLE-XXXX | Megacable | 33,549 | 0.23% | 1.5% |
AXTEL_XXXXXX | Axtel | 33,058 | 0.22% | 95.5% |
ARRIS/Moto/Technicolor-XXXX | cable CPE | 30,171 | 0.20% | 12.6% |
CablemasXXXX | Cablemás | 27,687 | 0.19% | 4.4% |
dlink-XXXX | retail router | 20,709 | 0.14% | 88.7% |
cablevisionNNN | Cablevisión | 9,004 | 0.06% | 44.0% |
2WIRENNN | Telmex (2Wire) | 4,960 | 0.0334% | 2.5% |
TOTALPLAYXXXX | Totalplay | 520 | 0.0035% | 11.5% |
| Total factory SSID | 7,291,417 | 49.13% | 72.1% |
Suffix shapes: x is a lowercase alphanumeric character, X is an uppercase hex digit, N is a decimal digit.
The INFINITUM families alone total 5,887,097 access points, or 39.7% of the archive. Their WPS rates run from 54.6% to 94.4% depending on which generation of gateway the customer received. The _2.4 suffix, marking dual-band units, is the worst of them at 94.4%.
Hardware: four suppliers, nine million radios
Vendor concentration is the reason a single firmware default reaches millions of homes at once. Distinct access points by IEEE OUI owner, top 14 of 101,072 observed prefixes:
| Vendor | Access points | Share | WPS on | WEP | Factory SSID |
|---|---|---|---|---|---|
| Huawei | 3,597,389 | 24.2% | 70.5% | 14.3% | 76.8% |
| Technicolor / Vantiva | 2,155,777 | 14.5% | 62.8% | 23.3% | 77.7% |
| CommScope / ARRIS | 1,785,990 | 12.0% | 84.0% | 1.9% | 61.1% |
| Arcadyan | 767,691 | 5.2% | 93.5% | 0.7% | 82.0% |
| TP-Link | 618,979 | 4.2% | 63.7% | 10.0% | 27.8% |
| Cisco / Linksys | 509,865 | 3.4% | 10.7% | 10.7% | 0.6% |
| Pegatron | 479,918 | 3.2% | 92.8% | 0.4% | 0.1% |
| Hon Hai / Foxconn | 421,298 | 2.8% | 12.8% | 15.8% | 6.4% |
| Nokia / Alcatel-Lucent | 316,608 | 2.1% | 26.8% | 0.6% | 88.3% |
| 2Wire | 314,915 | 2.1% | 0.2% | 84.3% | 81.6% |
| Taicang T&W | 207,611 | 1.4% | 95.6% | 0.7% | 52.5% |
| D-Link | 195,509 | 1.3% | 55.3% | 22.2% | 12.9% |
| Hewlett-Packard | 168,547 | 1.1% | 5.8% | 1.7% | 0.0% |
| Ruckus | 152,653 | 1.0% | 0.0% | 0.9% | 0.0% |
| (unregistered OUI) | 999,698 | 6.7% | 24.4% | 2.9% | 0.4% |
Attribution comes from the first three octets of each BSSID checked against the IEEE MA-L registry, not from the archive’s own vendor_id column, which does not agree with the addresses it labels. Vantiva is the former Technicolor/Thomson gateway business; CommScope absorbed ARRIS in 2019.
Huawei, Vantiva/Technicolor, CommScope/ARRIS and Arcadyan account for 8,306,847 access points, 56.0% of everything in the archive. The security posture attached to those prefixes is close to binary. Arcadyan’s blocks run 93.5% WPS. Two Thomson prefixes and the 2Wire block run above 81% WEP with essentially no WPS, because they predate it. Those are the gateways whose retirement produced the WEP collapse in the cohort table above.
A further 999,698 access points sit on prefixes with no IEEE registration at all. Combined with the 1,215,933 radios whose address has the locally-administered bit set, 8.2% of the archive, that is the signature of virtual SSIDs, Wi-Fi Direct, phone hotspots and MAC randomisation rather than of physical routers.
Spectrum: one band, three channels
97.1% of the archive is 2.4 GHz, and 72.1% of that crowds onto the same three channels.
| Channel | MHz | Access points | Share of band | |
|---|---|---|---|---|
| 1 * | 2412 | 3,881,010 | 26.92% | ██████████████████ |
| 2 | 2417 | 584,760 | 4.06% | ███ |
| 3 | 2422 | 447,239 | 3.10% | ██ |
| 4 | 2427 | 498,149 | 3.46% | ██ |
| 5 | 2432 | 367,194 | 2.55% | ██ |
| 6 * | 2437 | 3,069,076 | 21.29% | ██████████████ |
| 7 | 2442 | 395,111 | 2.74% | ██ |
| 8 | 2447 | 508,974 | 3.53% | ██ |
| 9 | 2452 | 553,477 | 3.84% | ███ |
| 10 | 2457 | 643,868 | 4.47% | ███ |
| 11 * | 2462 | 3,446,757 | 23.91% | ████████████████ |
| 12 | 2467 | 6,944 | 0.05% | ▏ |
| 13 | 2472 | 13,031 | 0.09% | ▏ |
* marks channels 1, 6 and 11, the only non-overlapping set. Each channel occupies roughly 22 MHz, so any two channels fewer than five apart interfere. Channels 12 and 13 are legal in Mexico but effectively unused, 0.14% combined, because North American firmware defaults cap the band at 11.
Only 423,032 access points, 2.9%, were recorded on 5 GHz. That undercounts reality, because the scanning handsets of 2015 often did not report the band. But within the cohorts the direction is unambiguous, and not one 6 GHz radio appears anywhere in 36,543,913 rows.
| Cohort | 5 GHz share | |
|---|---|---|
| 2015 | 1.71% | ██ |
| 2016 | 2.85% | ███ |
| 2017 | 4.80% | █████ |
| 2018 | 6.45% | ███████ |
| 2019 | 8.83% | ██████████ |
| 2020 | 9.23% | ██████████ |
| 2021 | 12.61% | ██████████████ |
| 2022 | 15.91% | ██████████████████ |
Geography: seven and a half million pins
7,543,488 access points carry a GPS fix that resolves to a Mexican state. All 32 appear. Two of them account for 37.7% of the total.
| State | Geolocated APs | Share | WPS | Weak | Factory SSID |
|---|---|---|---|---|---|
| Ciudad de México | 1,574,515 | 20.9% | 51.8% | 22.4% | 50.7% |
| México | 1,265,940 | 16.8% | 57.3% | 21.2% | 50.7% |
| Jalisco | 628,830 | 8.3% | 57.6% | 22.0% | 48.4% |
| Baja California | 470,091 | 6.2% | 65.3% | 19.6% | 46.3% |
| Veracruz | 330,290 | 4.4% | 59.8% | 23.5% | 51.2% |
| Nuevo León | 294,528 | 3.9% | 55.0% | 23.7% | 35.4% |
| Guanajuato | 271,514 | 3.6% | 58.0% | 23.4% | 49.4% |
| Puebla | 264,884 | 3.5% | 61.3% | 21.5% | 45.7% |
| Coahuila | 193,173 | 2.6% | 59.0% | 27.2% | 48.3% |
| Tamaulipas | 189,452 | 2.5% | 58.3% | 26.4% | 50.8% |
| Michoacán | 177,419 | 2.4% | 63.6% | 23.5% | 51.4% |
| Chihuahua | 165,948 | 2.2% | 59.9% | 23.1% | 48.6% |
| San Luis Potosí | 163,964 | 2.2% | 48.9% | 23.8% | 44.2% |
| Sonora | 150,567 | 2.0% | 63.2% | 24.1% | 48.5% |
| Hidalgo | 132,388 | 1.8% | 50.3% | 26.3% | 44.4% |
| Querétaro | 127,891 | 1.7% | 54.9% | 23.5% | 41.7% |
| Guerrero | 124,674 | 1.7% | 60.8% | 24.4% | 51.2% |
| Oaxaca | 118,007 | 1.6% | 57.5% | 25.2% | 48.2% |
| Morelos | 107,228 | 1.4% | 62.9% | 19.8% | 48.2% |
| Quintana Roo | 104,020 | 1.4% | 51.0% | 22.8% | 43.9% |
| Sinaloa | 82,925 | 1.1% | 62.3% | 25.6% | 48.5% |
| Aguascalientes | 78,579 | 1.0% | 54.8% | 25.1% | 45.3% |
| Chiapas | 76,555 | 1.0% | 55.1% | 27.4% | 48.2% |
| Baja California Sur | 75,133 | 1.0% | 57.7% | 26.5% | 58.1% |
| Tabasco | 62,630 | 0.8% | 50.7% | 27.2% | 47.0% |
| Zacatecas | 61,363 | 0.8% | 53.3% | 28.9% | 46.8% |
| Colima | 56,694 | 0.8% | 61.9% | 25.8% | 55.4% |
| Tlaxcala | 48,831 | 0.6% | 53.4% | 29.2% | 48.3% |
| Durango | 47,046 | 0.6% | 59.7% | 25.8% | 48.7% |
| Yucatán | 38,355 | 0.5% | 52.4% | 24.9% | 43.2% |
| Nayarit | 34,096 | 0.5% | 62.7% | 25.1% | 52.3% |
| Campeche | 25,958 | 0.3% | 48.6% | 26.0% | 44.0% |
Coordinates are the wardriver’s position, not the router’s, so a state’s total reflects where people drove with the app running. Shares within a state are more trustworthy than totals between states.
The security spread between states is narrow. The weak-protocol share runs from 19.6% in Baja California to 29.2% in Tlaxcala, which is what you would expect from a market where the same four vendors supply everyone. The default-SSID share varies more: 58.1% in Baja California Sur against 35.4% in Nuevo León, the lowest in the country.
What else is on the air
| Category | Access points | Share |
|---|---|---|
| Hidden SSID (empty name) | 559,122 | 3.8% |
| Locally-administered MAC | 1,215,933 | 8.2% |
| Ad-hoc / IBSS | 280,659 | 1.9% |
| Enterprise (802.1X) | 163,549 | 1.1% |
| TKIP anywhere in the suite | 7,275,964 | 49.0% |
| Seen exactly once | 9,227,123 | 62.2% |
Hidden SSIDs broadcast an empty name, a setting that stops nothing, since the network still answers probes. It correlates with almost no WPS, just 6.1%, because the people who set it also turn WPS off.
The most common network names, counted over observations rather than distinct radios, so mobile and multi-AP names rank high:
| SSID | Sightings |
|---|---|
MXConectado-E | 75,572 |
AndroidAP | 75,416 |
infinitum movil | 61,528 |
00 Axtel WiFi Xtremo | 59,458 |
WiCoin | 50,362 |
Motorola | 46,185 |
..ZonaYOO.. | 39,085 |
SETUP | 35,429 |
linksys | 30,985 |
dlink | 26,933 |
arris54g | 23,962 |
..izzi-WiFi.. | 20,736 |
IZZI WiFi | 20,723 |
MXConectado-I | 17,391 |
Servicios_Liverpool | 14,861 |
MxConectado-E | 13,714 |
*.Megacable WiFi.* | 13,659 |
COM-818 | 11,484 |
NETGEAR | 11,371 |
iPhone | 9,698 |
These are the carrier hotspot fleets, with MXConectado being the federal public-Wi-Fi programme, plus one recurring reminder that phones broadcast too.
Method and limits
The parser recovered 36,543,913 of 36,545,105 auto-increment IDs, or 99.997%, the remainder being rows deleted before the dump. It was checked against raw byte counts on a 150 MB slice: row boundaries and [WEP], [WPS], 'MX' and 'none' occurrences all agreed to within 0.03%, with the residual explained by those substrings appearing inside SSID text. The 16 shards span IDs 1 to 36,545,105 with no gaps and no overlaps.
The archive is not Mexico-only. 76.9% of rows carry country code MX, with Spain, the United States and Colombia next, and of the MX rows that carry coordinates, 99.9% fall inside Mexico’s bounding box. A further 3,565,193 rows carry no country label at all; 95.5% of those with coordinates are also inside Mexico, and folding them in moves the headline shares by about half a point. The weak-protocol share goes from 22.97% to 22.47%, on 16,481,657 access points.
The table stores observations, not devices, so counts are collapsed to distinct BSSIDs keeping the first row per address, which is also the earliest by construction since IDs are assigned in insertion order. 62.2% of Mexican access points appear exactly once. The encryption column holds Android’s raw capabilities string across 1,600 or more distinct forms; each was decomposed into flags (WEP, WPA, WPA2, WPA3/SAE, OWE, WPS, TKIP, CCMP, EAP, IBSS) and reduced to a single protection tier by the strongest suite advertised.
Two data-quality traps worth naming, in case anyone works with a similar dataset. The archive’s own vendor_id column is unreliable. The id whose vendors row holds OUI 4A44F7 labels 4.5 million rows, but only 3,998 MAC addresses in the table actually begin with 4a:44:f7. And the coords column stores longitude first, with a handful of rows containing infinities, so both need range-checking before use.
The honest limitations: front-loaded to 2015 through 2017, a 2.4 GHz-biased instrument, opportunistic geographic coverage. WPS is read from the beacon, which advertises the feature but not whether the PIN method is actually enabled, so 57.2% is an upper bound on exploitable WPS rather than a measurement of it. And vendor attribution credits ODM-built hardware to the ODM rather than to the operator whose logo is on the box.
Conclusion
Three things I take away from this.
The industry fixed WEP, and it fixed it fast, going from 18.2% to 0.9% in four cohorts, but only because it was a hardware refresh cycle, not because anybody changed a setting. Nothing in this data suggests users fix anything.
The replacement hardware shipped with WPS on, and that exposure has not moved in seven years. We swapped a broken cipher for a bypassable one and called it an upgrade. For 5.2 million access points here, a strong WPA2 passphrase buys nothing.
And the default-SSID problem I wrote about in 2011 is not a historical curiosity. Four in ten networks in this archive still advertise which key-derivation recipe to try, on a market where four suppliers build more than half the hardware. One firmware default, eight million homes.
If you own one of these: change the SSID, turn off WPS in the gateway’s admin page, and set your own passphrase. Three minutes, and it takes you out of every number above.